
Dashboard
Created by: Emma Johnston
Last updated: August 4, 2021
Business Performance Overview
Your Dashboard is an overview of your business. This is the first thing that you will see when you log into the system. It will outline the progress and performance of your business. Here are the potential different parts of your default. The content of your dashboard will depend on your user permissions.
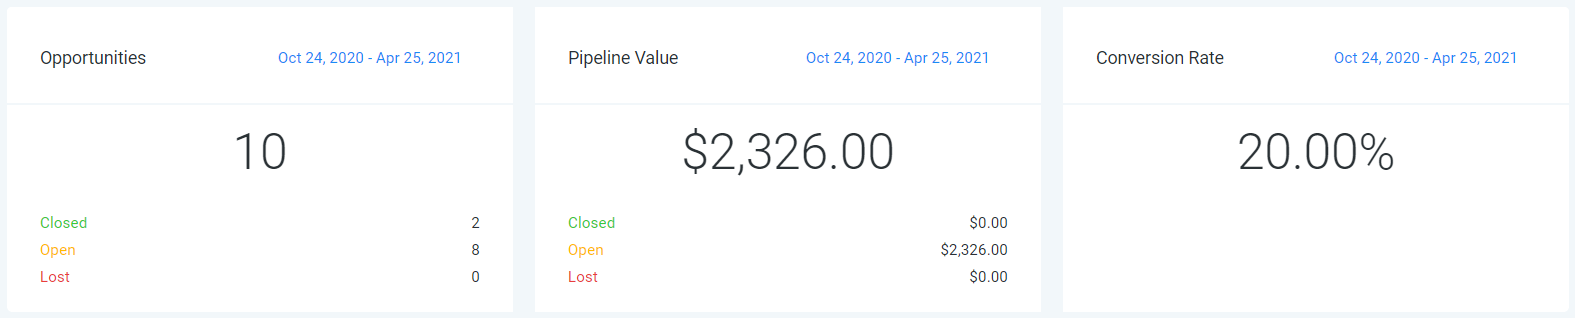
ROW 1 - OPPORTUNITIES
Click on the blue date in the top right corner of any box to change the date range.
- Opportunities – Number of Leads in your Pipeline
- Pipeline Value – All your leads' total worth
- Conversion Rate – Percentage of your ‘WON’ leads/accounts
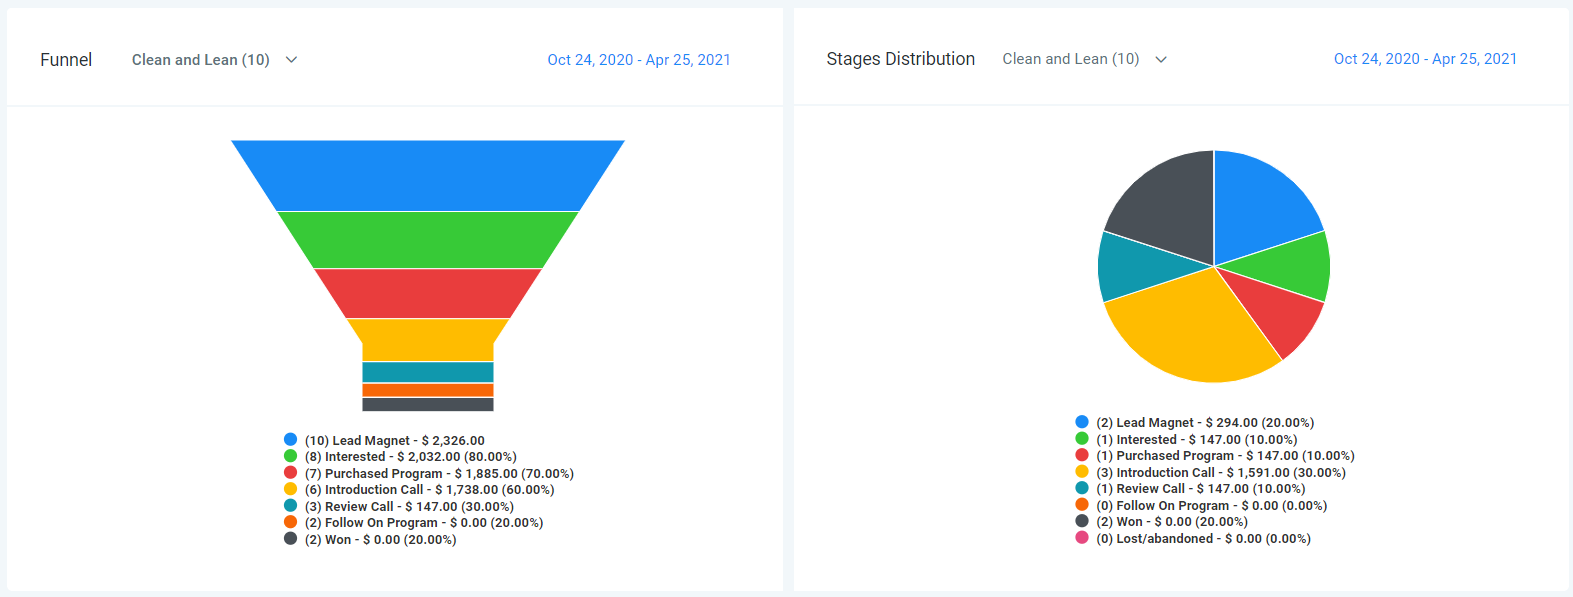
ROW 2 - PIPELINES STAGES
Click on the blue date in the top right corner of any box to change the date range.
- Funnel – A visual representation of what stages your opportunities have passed through within your pipeline. Use the drop-down menu to change pipelines. Click on a pipeline stage to hide it from the funnel.
- Stages Distribution – This is a cycle graph of your pipeline and is a visual representation of what stage your opportunities are currently in. Use the drop-down menu to change pipelines. Click on a pipeline stage to hide it from the chart. Click on the blue date in the top right corner to change the date range.
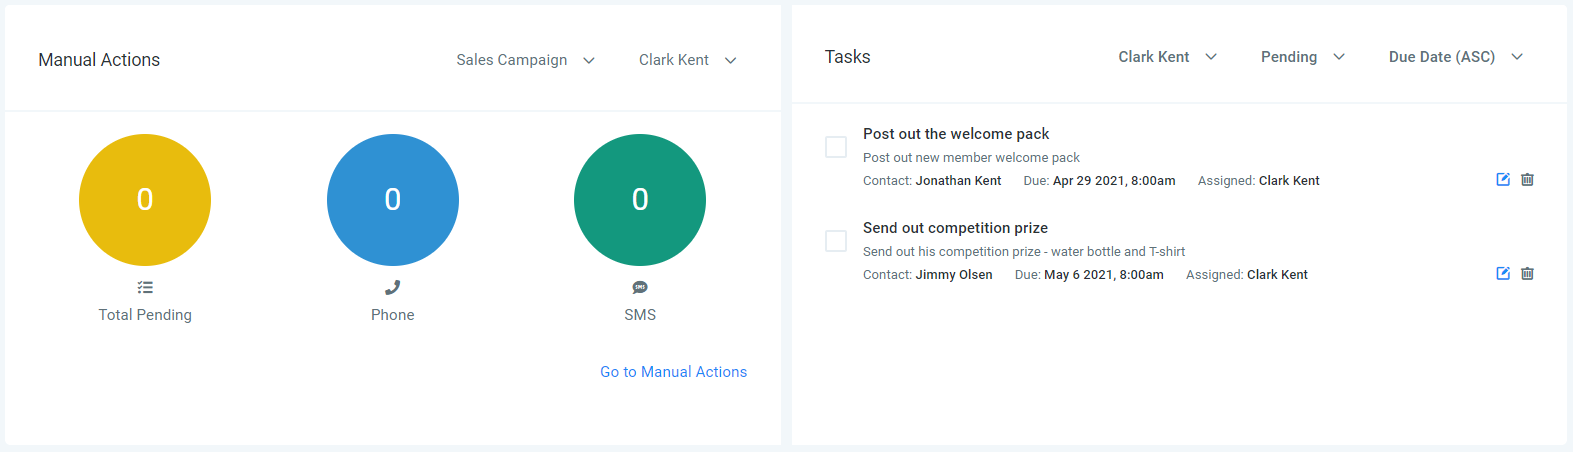
ROW 3 - TASKS
- Manual Actions – An overview of manual actions (add through manual events in a campaign). Use the drop-down menus to select a campaign and user.
- Tasks – A list of assigned tasks for one or all users within your account. Use the drop-down menus to select a user, task status (all/ pending/complete), or sort by date (ascending/descending).
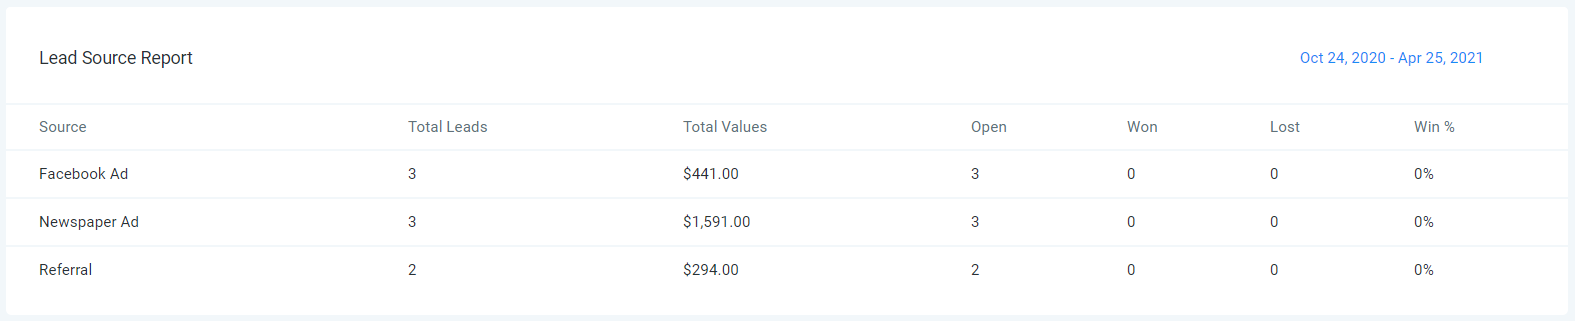
ROW 4
- Lead Source Report – Here you can see where your leads came from and what their values are.
ROWS 5/6/7 - FACEBOOK, GOOGLE AND GMB
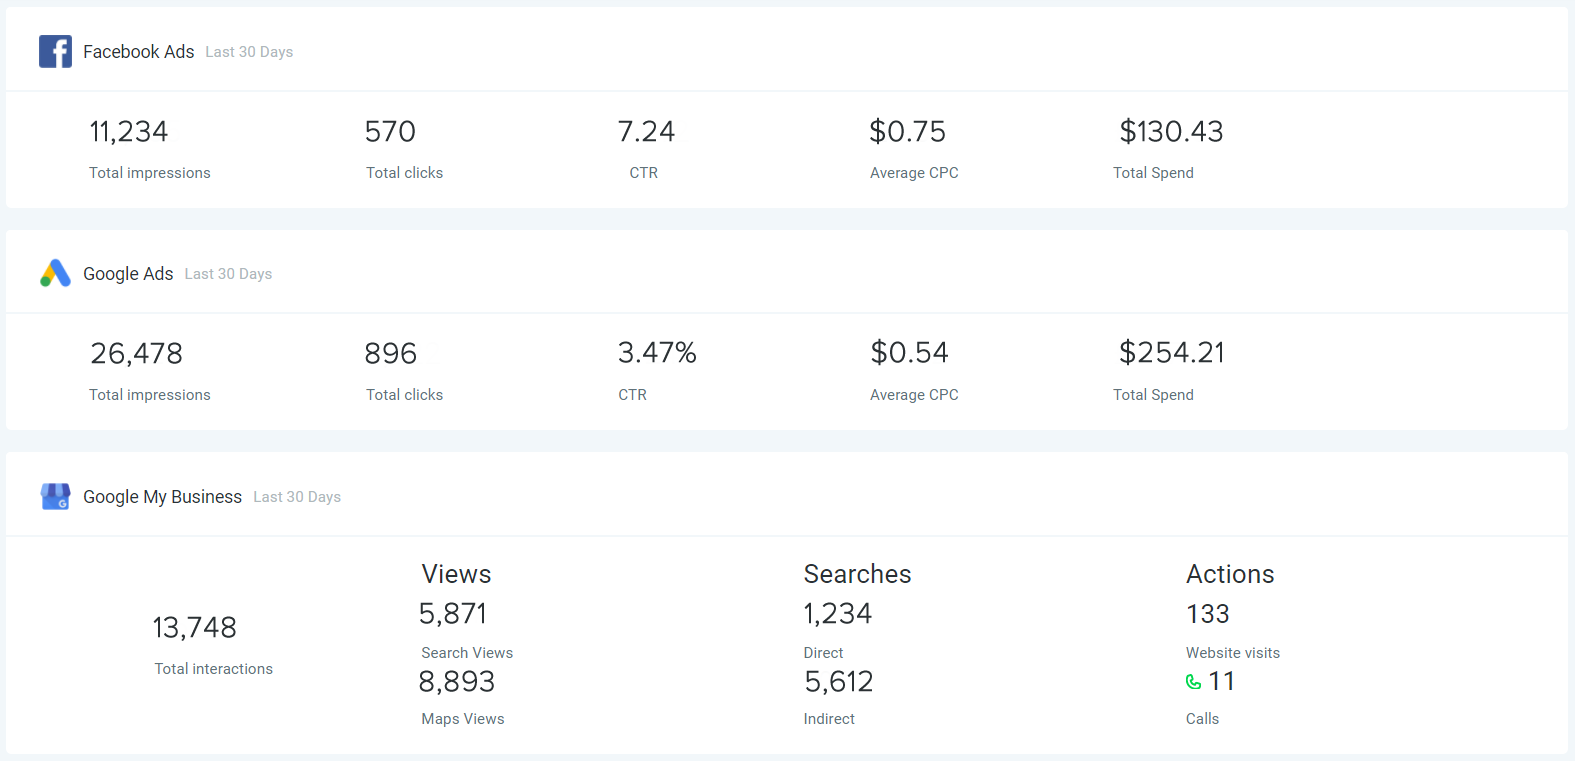
- Facebook Ads – Here you see an overview of your Facebook ads for the last 30 days (if you have added Facebook).
- Google Ads – Here you see an overview of your Google ads for the last 30 days (if you have your Google Ads Account).
- Google My Business – Here you can track your ranking for the last 30 days (if you have added Google My Business)
ROW 8/9 - GOOGLE ANALYTICS
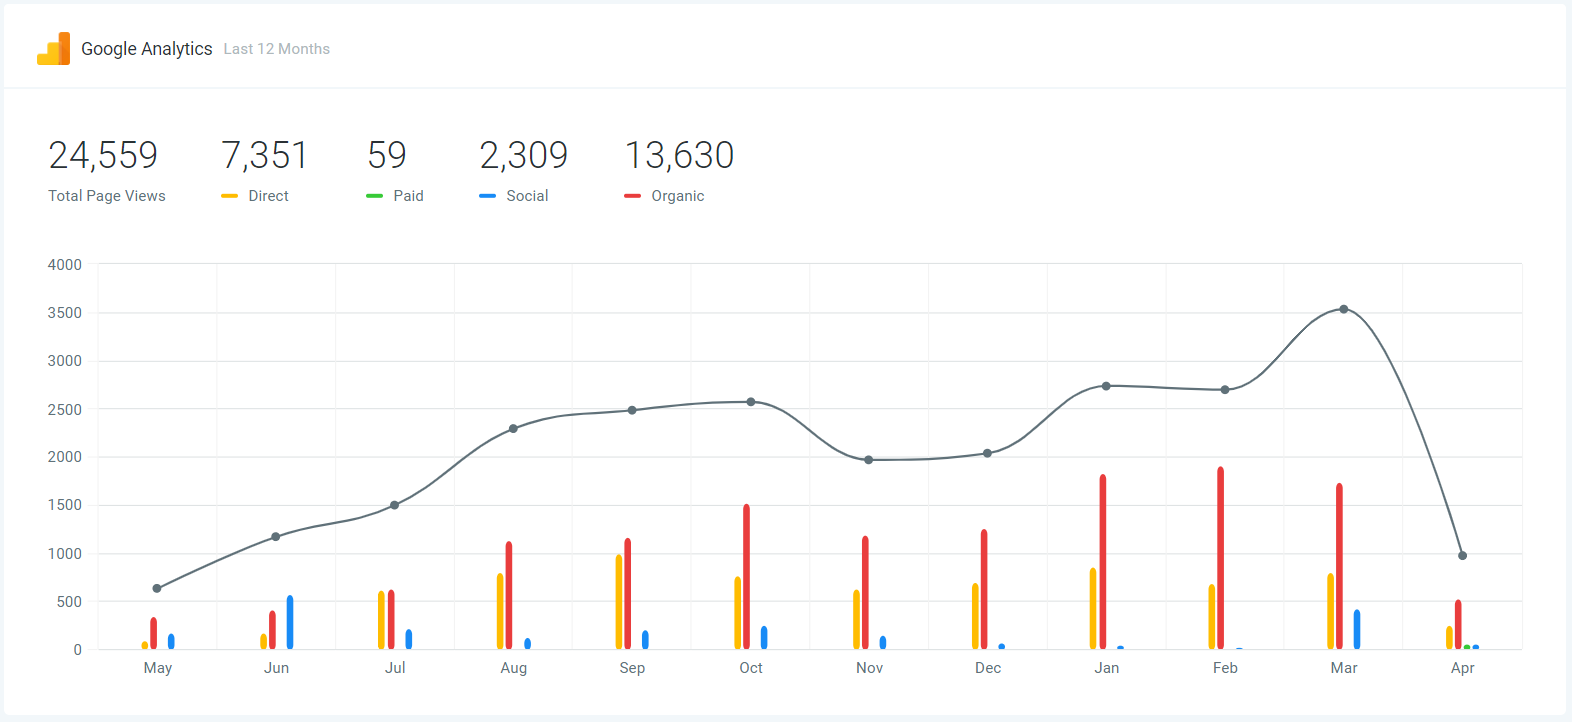
- Google Analytics – Here you can track the number of visitors to your website over the last 12 months and see where they came from (direct, paid, social or organic). You must have Google Analytics set up on your Google account.

If you have a quick, system-specific "how-to" question, you can chat with our L1 Technical Support Team using the purple chat bubble in the bottom corner of the software. This team offers live chat 24/7, giving you instant access to help at any time of day.
If you have a more complex or outcome-specific “how-to” question, or a query about project requests, done-for-you resources, or Coach Catalyst, you can email our L2 Specialist Team at [email protected]. This team is available Monday to Friday, 8:00am – 1:00pm (EDT).
© 2026 SuperCoach CRM